By Matt Burdett, 28 June 2019
In this article, we look at the causes of urban deindustrialization and its economic, social and demographic consequences.

- Lynchberg, Virginia, USA, is a former transport hub for manufactured products crossing the Blue Ridge Mountains on the James River. Today, the main street has many empty stores and few customers. Source: By the author.
What is urban deindustrialization?
Urban deindustrialization refers to the loss or reduction in secondary industry in towns and cities. For the purposes of this article, urban deindustrialization is defined as a drop in the total number of people employed in manufacturing in an urban area.
This sounds simple but actually there are several other ways to measure this loss:
- A decline in the percentage share of manufacturing employment compared to the percentage in other economic sectors
- A reduction in the physical output of manufacturing (by weight or volume)
- A reduction in the income earned from manufacturing
- A reduction in the percentage of the local economy produced by manufacturing
Where is urban deindustrialization happening?
It is common to think that it is only HICs like the USA, Australia and Italy that are experiencing a loss of urban industry. In fact, these HICs generally lost their manufacturing employment several decades ago. This was due to the globalization process (outlined in more detail below): put simply, in the 1960s, ‘70s and ‘80s the Asian Tiger economies like South Korea, Taiwan and Singapore could offer cheaper labour. Some industry remained in the traditional HICs but the number of people working in manufacturing continued to decline. Now, the HICs have only a small number of employees in manufacturing, and they are often producing very high specification products such as aircraft engines and medical equipment. The graph below shows how the percentage of people employed in manufacturing for all of the top seven global economies has been decreasing for decades. Industrialization is nothing new for these countries.
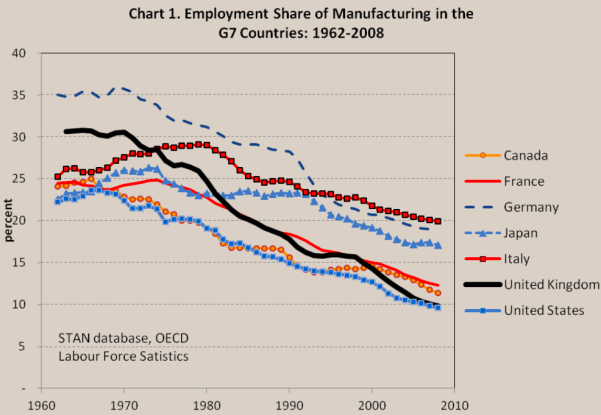
- Employment share of manufacturing in G7 countries. Source: Rowthorn and Coutts, 2013.
When this is shown using total numbers (rather than a percentage of all employment) the trend remains. There was a peak in the 1960s and 1970s and since then all G7 countries have seen a drop in the total number of people employed in manufacturing.
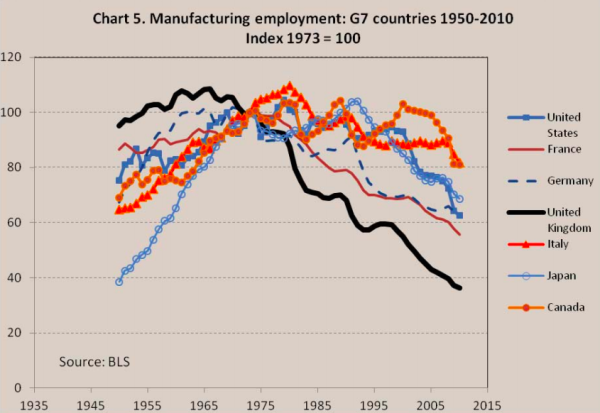
- Total employment in manufacturing in G7 countries. Note: the graph does NOT show the numbers of people involved in manufacturing. It takes 1973 as a reference point (“100”) and shows the increase or decrease before and since. Source: Rowthorn and Coutts, 2013.
Today, the main countries experiencing a loss of employment in manufacturing are Newly Industrialised Countries (NICs) and MICs. As shown on the graph below, since the 1990s, these countries have been losing their manufacturing employment.
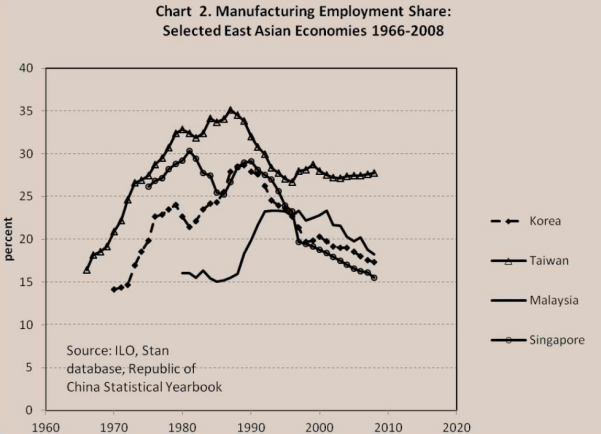
- Employment share of manufacturing in selected ‘Asian Tiger’ economies. Source: Rowthorn and Coutts, 2013.
What are the causes of urban deindustrialization?
There are several causes of deindustrialization in general:
- Automation: as machinery becomes cheaper, more complex and more reliable it does the work that used to be done by humans
- Development of alternative industries: as countries get richer, they develop more service industries which take up a greater share of employment
- Movement to lower cost production centres: MICs such as China are now themselves becoming too expensive, and are beginning to off-shore their manufacturing to lower cost production centres in Africa and other parts of Asia
There are also specific causes of deindustrialization in urban areas:
- Larger sites required for efficiency: existing factory locations are too small for the mass production required to be profitable in the global marketplace, making historic urban industrial sites less competitive and more likely to close down
- Transport developments: as more products are made for global export, the requirement to be near a mass transport hub (such as a container port, or at least a major railway lines) has made some urban centres unprofitable
- Cities as service centres: cities in HICs and MICs are increasingly service centres offering retail, educational, legal and financial employment and making the manufacturing sector less attractive to potential employees
The consequences of urban deindustrialization
The impacts of the reduction of employment in industry are significant for any area. It is difficult to quantify the effect on specific urban places because:
- Many impacts are not quantifiable, such as drop in aspirations of young people in an area.
- Impacts that are quantifiable such as employment, migration and income are often not published for the small scale of an urban area. They are instead published at regional or national levels.
- Urban deindustrialization is just cause of socioeconomic change. Other causes such as the desire for improved education can cause people to migrate away from old industrial centres. It is hard to know the extent of the contribution from deindustrialization.
Even so, it is clear that in many places the loss of manufacturing employment is significant and has had economic, social and demographic impacts.
Economic consequences
On a national scale the most surprising consequence of deindustrialization is that it hasn’t involved a decrease in industrial output. Despite fewer people doing the work, there is actually more being produced (in dollar value of products).
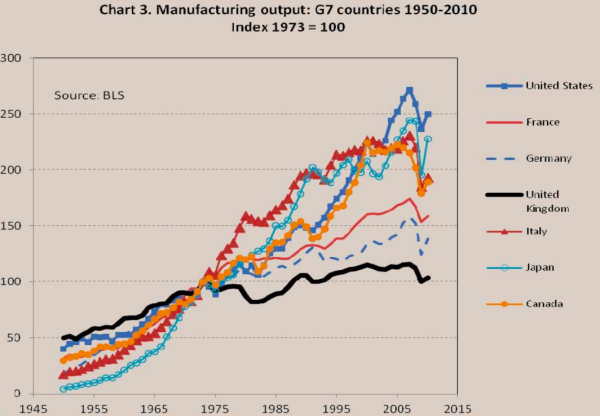
- Manufacturing output as a percentage compared to 1973 in G7 countries. Source: Rowthorn and Coutts, 2013.
The graph below shows the output per manufacturing employee, and hints at one major cause of deindustrialization: automation. For the employee to manufacture more each year, there must be either a more expensive product being made, or there must be machinery doing some of the work. Either way, the manufacturing business is able to produce more while paying fewer workers, which makes the business more profitable.
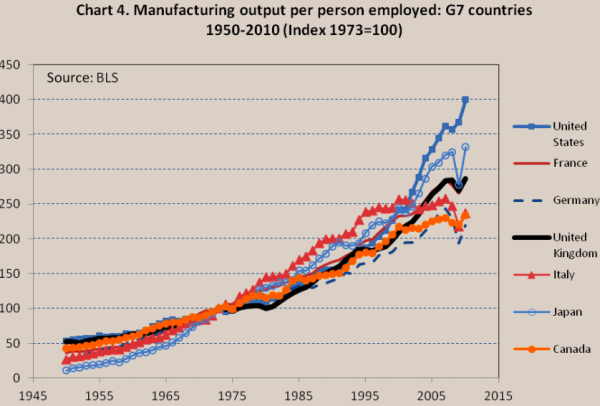
- Output per worker for manufacturing in G7 countries. Source: Rowthorn and Coutts, 2013.
Creative destruction
This highlights a major point of contention: should the old ways be preserved because they support the livelihoods of more people, or new ways be introduced because they generate more money for the economy?
The loss of industries as part of a natural shift in economies that eventually bring other benefits is known as ‘creative destruction’ and was outlined in 1942 Joseph Schumpeter based on the works of Karl Marx. He argued that in order for an economy to keep growing and adapting it would need to lose inefficient or non competitive industries. (There is a lot more to this theory; the Wikipedia page has a good summary.) The benefits would be felt thanks to an overall shift in the economy to new and more competitive sources of income.
This extra money can be reinvested into education, healthcare and transitioning the economy towards services and most governments have policies that aim to do this. However, these benefits are often felt unevenly and old industrial centres do not experience the same economic improvement as bigger cities or regional hubs.
Growth in manufacturing despite deindustrialization
Another surprise is that the economies of the countries that have had the most deindustrialization have continued to grow. The graph below shows the per capita income in economies of selected countries and how they have grown despite, or perhaps because of, the move away from manufacturing industries.

- GDP per capita for selected countries. Source: Rowthorn and Coutts, 2013.
In summary, deindustrialization has not contributed to economic decline on a national scale. However, the concept of scale is important here. The places within countries that have lost their industry are not necessarily the places that have experienced the improvement in their local economy. In fact, inequality within countries may increase as some places become even more wealthy while others become extremely impoverished.
Inequality: the Kuznet Curve
The economist Simon Kuznet wrote in the 1950s and ‘60s that income inequality rises then falls after industrial transition. He was talking about countries that were changing from an agrarian (agricultural) economy to a manufacturing one. He suggested that during the transition phase, inequality becomes very severe but people become more equal later. He showed this using the ‘Kuznet Curve’ shown below.
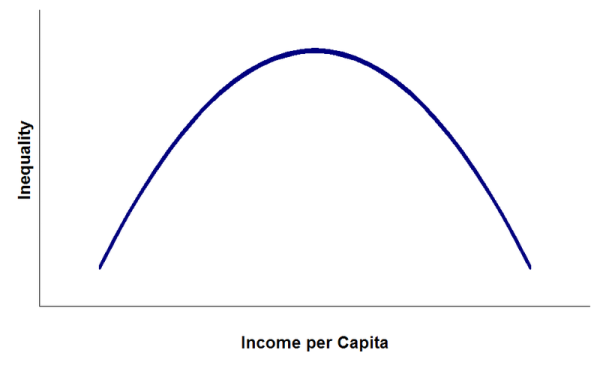
- Kuznets Curve, showing how as countries become wealthier in the transition from agricultural to manufacturing economies, income inequality goes up and then down. Source: Princess Tiswas, 2007.
Kuznet was writing before the first industrial countries experienced deindustrialization. Today, inequality is higher than it has been in the modern age for several HICs. The new high-tech jobs are not accessible for most of the population owing to the level of technical specialization required, and government redistribution programmes do not appear to be effective in regenerating urban areas that have lost their industries.
Social consequences
Youngstown in Ohio, USA, is an example of a deindustrialized town. In the 1980s it lost 50,000 jobs in the steel industry, and it has continued to lose jobs in the car industry since then (Russo and Linkon, 2015). Russo and Linkon identify several negative social consequences of deindustrialization:
- The loss of jobs, homes and health care
- Reductions in the tax base, so less spending on services like police and fire
- This can lead to an increase in crime
- Increases in abuse of drugs and alcohol, and also violence and depression
- Political impacts such as a loss of trust in government, churches, businesses and trades unions
However there are also positive social impacts. Many manufacturing industries involve heavy, dangerous or labourious work which has a negative impact on health. By switching to less physical industries, the health of the population may increase. The pollution caused by manufacturing may also decline, resulting in a healthier environment. Social mobility may also increase, as people who previously expected to do an entire lifetime working in manual labour find they have a wider range of options. There can also be benefits to the general visual appeal of a town and its social amenities. The photograph below shows the town of Lynchburg, VA, USA, which has lost its main street but gained a new riverside entertainment district housed in former industrial buildings. However, all these are dependent on their being an alternative employment opportunity in place, rather than a simple lack of any employment.

Lynchburg: The old industrial areas have become new homes, bars, restaurants and shops. Source: By the author.
Demographic consequences
The demographic consequences of deindustrialization depend on whether there is a new industry to replace the old manufacturing industry. If there is, then there is unlikely to be any major demographic change.
If there is no new industry, the lack of employment opportunities is likely to lead to out migration. The total population of a place may decline, and the average age is likely to increase as it is mainly younger people who will move in search of work. There is little evidence about a gender imbalance in all but the most traditional societies: in general, women and men are equally as likely to migrate to find work.
Sources
Princess Tiswas, 2007. Kuznets Curve. https://en.wikipedia.org/wiki/Kuznets_curve Accessed 27 June 2019.
Rowthorn and Coutts, 2013. De-industrialisation and the Balance of Payments in Advanced Economies. Working Paper No. 453. Centre for Business Research, University Of Cambridge. https://www.cbr.cam.ac.uk/fileadmin/user_upload/centre-for-business-research/downloads/working-papers/wp453.pdf Accessed 27 June 2019.
Russo and Linkon, 2015. The Social Costs Of Deindustrialization. Youngstown State University. http://cwcs.ysu.edu/wp-content/uploads/2015/11/The-Social-Costs-Of-Deindustrialization.pdf Accessed 28 June 2019.
Urban deindustrialization: Learning activities
Questions
- Define ‘deindustrialization’ and explain why you chose this definition. [3]
- In what types of country is deindustrialization currently occurring, and why? [4]
- Describe the economic consequences of deindustrialization at the national scale. Include a reference to the Kuznet Curve in your answer. [4]
- Describe the possible economic consequences of deindustrialization at the local urban scale. [4]
- Describe the possible social consequences of deindustrialization at the local urban scale. [4]
Other tasks
Visit https://www.gpidnetwork.org/2018/06/15/what-are-the-drivers-of-deindustrialisation-and-why-does-it-matter/ by Lukas Schogl. Add to your notes about the causes of deindustrialization and suggest why it is important for Geographers to understand this process.
© Matthew Burdett, 2019. All rights reserved.
All secondary material on this site is clearly referenced and may be subject to copyright restrictions by the original authors. All original material on this page is subject to copyright.
